Colour Identification of Top 500 Brands using Python

About the Project
My program exists to help understand the colours used in the logos of the 500 most valuable brands in the world. Colours convey certain characteristics and emotions and understanding what colour the most valuable brands in the world use helps us understand how they position themselves and how they want their brands to be perceived in the market.
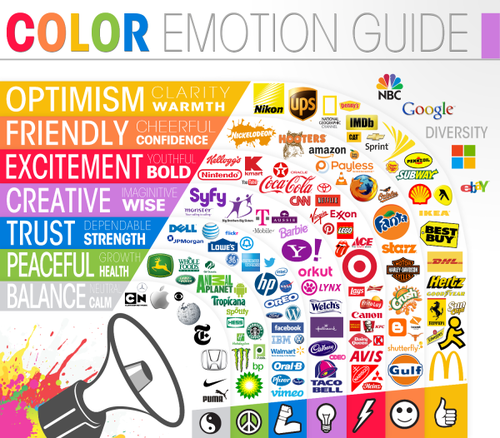
Photo by coolinfographics.com
How to use the Program
The program requires some prerequisite libraries, they are the following:
CSV, Maplotlib, Pillow (PIL) and Colour.
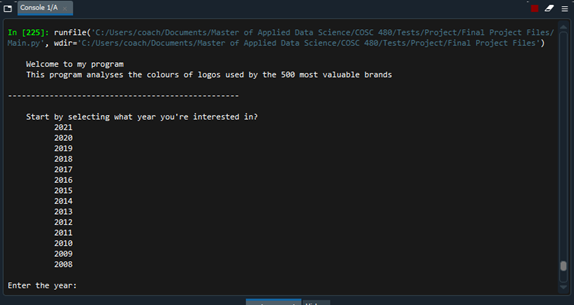
After executing main.py, you will be greeted with a welcoming message and an option to select the data set you want to use for the analysis. You can select one of 13 data sets ranging from 2008 to 2021. Once a data set has been selected, the program analyses all 500 logos in that year. This step may take up to a minute.
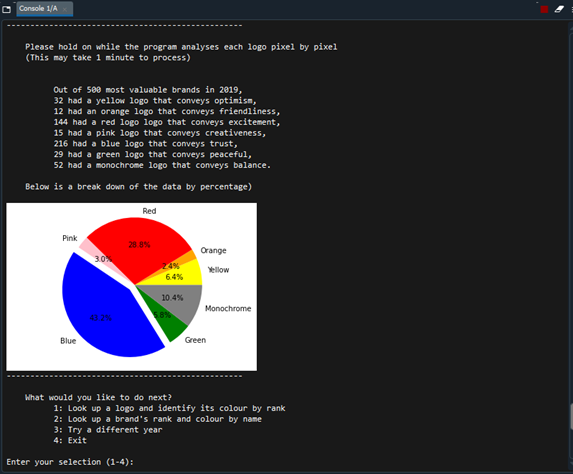
Then a summary will be shown of how many logos are in any given colour. Below that, the same data will be used to create pie chart for easy interpretation of the data.
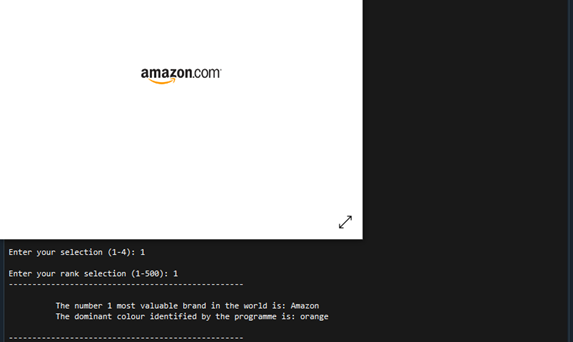
Then you will be presented a menu with four options to choose from. The first one allows you to look up a logo and identify its colour by rank. When chosen, enter a number from one to 500 and the brand name, the logo and the prominent colour identified by the program will be shown.
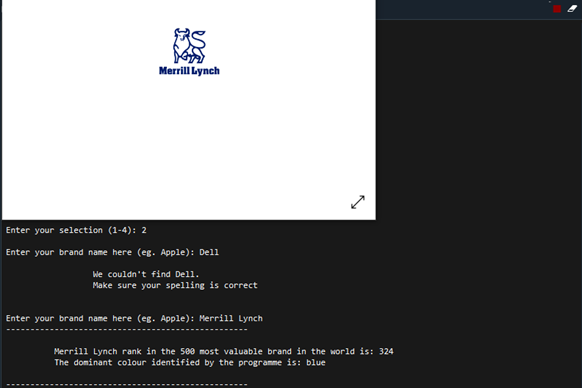
If you select option two instead, you can look up a brand’s ranking and prominent colour by typing the name of the brand you are interested in. This option requires an exact match.
Option number three allows you to change the dataset and choose a different year instead.
Option four simply closes the program.
Code
For the full code, visit the project's GitHub page below:
Background
I have decided to use all data sets BrandFinance had, except 2007. At that time they only had rankings up to 250 and for consistency I have chosen to not include that data set. The function image_scan takes an image file and reads the rgba value of all pixels. RGBA, stands for red, green, blue and alpha. The function also removes the RGB value (255, 255, 255) for white and the RGBA value (0, 0, 0, 0) for transparency as they are oftentimes the background element of the logo image. Alpha values describe the transparency of a pixel, since I am only concerned about colour hue, the alpha channel is not needed. Function processing_rgba then removes the alpha channel. Function rgb_to_hsl converts the RGB values to HSL values using the colours library. HSL stands for hue, saturation and lightness and makes setting colour boundaries easier. In HSL, the hue value is represented in a 360 degree circle with a value from 0 – 360. In function find_dominant_colour boundaries are set for each of the six colours plus monochrome (black and white). But since the colours library sets the HSL values to a scale of 0 – 1 instead of the conventional 0 – 360, each HSL value has been multiplied by 360 (after making sure they were not in radians). The colour boundaries are set using Figure 1 as guidance but some logos may seem to be falsely categorized to a neighboring group since setting the boundaries is very subjective.